
FxPro Raw+ Live Spreads — Measured, Not Advertised (United Arab Emirates)
Real spreads we recorded on FxPro’s own MetaTrader 5 Raw+ feed — 6 instruments, 3,714,831 ticks sampled, last captured 2026-09-15. The spread you actually trade on, not a marketing ‘from 0.0’.
Open FxPro Account →Two numbers decide what anything on this page costs you in local money, and only one of them moves. The spread is measured on FxPro's own MetaTrader 5 Raw+ feed and re-read on a schedule: it widens around the daily rollover, thins out in the quiet hours, and every figure below carries the moment it was captured. The other number, the rate between the dirham and the dollar, is held fixed — so turning any of these dollar costs into a local figure is one multiplication that will still be correct next month. Read the tables with that split in mind. The currency side of your planning is already settled; the spread side is the part worth checking before a session.
This is the live, hour-by-hour measured spread feed (refreshed daily). For the Standard vs Raw+ cost comparison and fees, see our spreads & costs page.
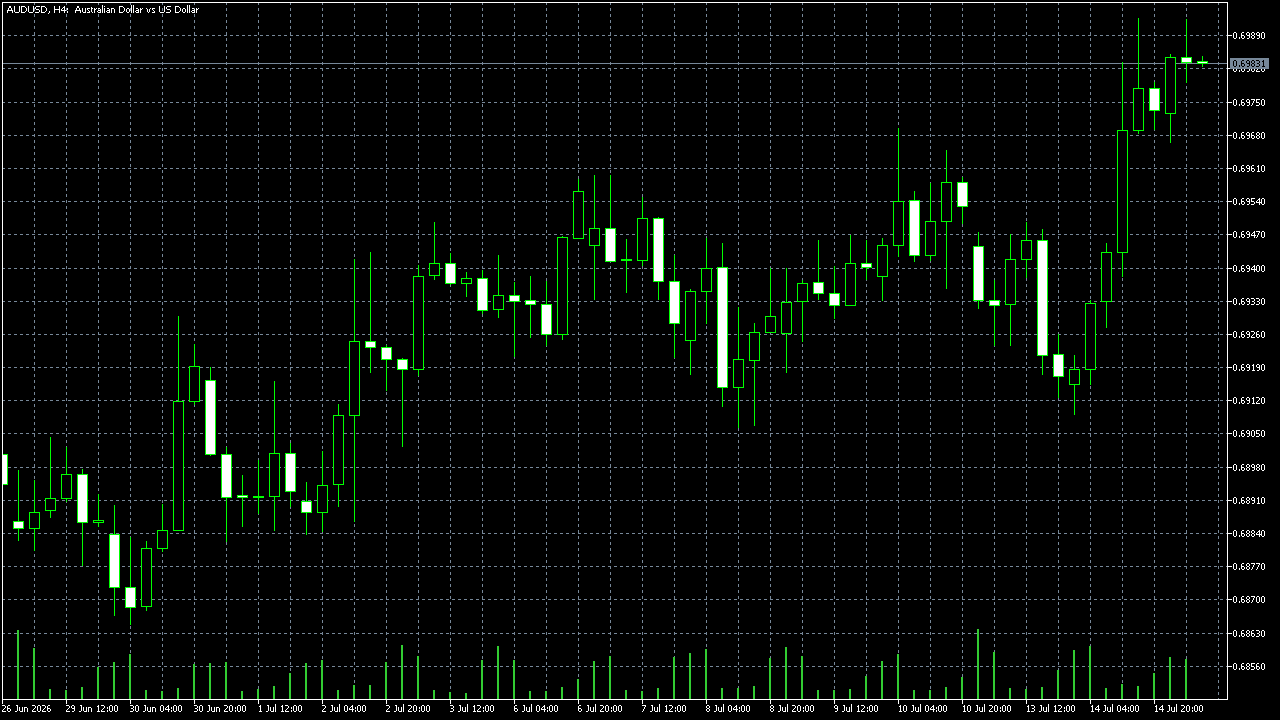
Measured Raw+ spreads (pips)
| Instrument | Best (min) | Typical (median) | Busy market (p90) | At capture | Ticks sampled |
|---|---|---|---|---|---|
| EUR/USD | 0.1 | 0.2 | 0.2 | 0.2 | 457,098 |
| GBP/USD | 0.6 | 0.6 | 0.6 | 0.6 | 590,492 |
| AUD/USD | 0.2 | 0.4 | 0.8 | 0.4 | 511,715 |
| USD/CAD | 0.1 | 0.4 | 0.5 | 0.4 | 465,429 |
| USD/JPY | 0.3 | 0.3 | 0.5 | 0.3 | 717,421 |
| XAU/USD (Gold) | 15 | 15 | 19 | 15 | 972,676 |
Best = the tightest quiet-market quote we saw; Typical = the median you usually trade; Busy market = the wider spread to expect about 10% of the time (news, rollover, thin liquidity). ‘At capture’ is the live spread at the last reading. Metals such as XAU/USD use a different contract size, so their cash cost is on our gold page. Server FxPro-MT5 Demo, feed 2026.09.15 14:10:41.
Spread through the trading day (measured, last 24h)
| Instrument | Tightest (avg) | Widest (avg) | Worst spike | Through the day |
|---|---|---|---|---|
| EUR/USD | 0.2 (03:00) | 1.782 (00:00) | 9.5 (00:00) | |
| GBP/USD | 0.6 (03:00) | 3.627 (00:00) | 15 (23:00) | |
| AUD/USD | 0.292 (14:00) | 3.98 (00:00) | 25 (23:00) | |
| USD/CAD | 0.292 (09:00) | 2.318 (00:00) | 13.6 (23:00) | |
| USD/JPY | 0.3 (09:00) | 7.082 (00:00) | 16 (23:00) | |
| XAU/USD (Gold) | 15 (09:00) | 75.421 (00:00) | 175 (00:00) |
Table hours are FxPro server time (about UTC+3 / EET); the highlighted guidance above is shown in GST. Average pip spread by hour over the last 24 hours, with the worst single-tick spike. Spreads run tightest in the peak London–New York overlap and widen around the 00:00 server rollover and the thinner Asian hours — the sparkline is each instrument’s daily shape.
What it costs you per lot (Raw+)
| Instrument | Typical spread | Spread cost / lot | Commission (round turn) | All-in / lot | All-in (pips) |
|---|---|---|---|---|---|
| EUR/USD | 0.2 pips | $2.00 | $7.00 | $9.00 | 0.9 pips |
| GBP/USD | 0.6 pips | $6.00 | $7.00 | $13.00 | 1.3 pips |
| AUD/USD | 0.4 pips | $4.00 | $7.00 | $11.00 | 1.1 pips |
| USD/CAD | 0.4 pips | $2.87 | $7.00 | $9.87 | 1.37 pips |
| USD/JPY | 0.3 pips | $1.94 | $7.00 | $8.94 | 1.38 pips |
| XAU/USD (Gold) | 15 pips | $15.00 | $7.00 | $22.00 | 22 pips |
All-in round-turn cost for one standard lot (100,000 units): typical spread × pip value, plus the $7 Raw+ commission ($3.50 per lot per side ($7.00 round turn) on Raw+ and cTrader accounts). On a Standard account you pay a wider spread instead of that commission — see the full spreads and costs page.
Open FxPro Account →Advertised ‘from 0.0’ vs what we measured
FxPro markets Raw+ as spreads ‘from 0.0 pips’ — a best-case floor. Across our sample the tightest EUR/USD quote we recorded was 0.1 pips and the typical was 0.2 pips. That is normal: the ‘from’ figure is a floor you rarely trade on, so judge a Raw+ account by its typical spread and how far it widens under load (the p90 column), not the headline number.
How we measured this
- Recorded on FxPro's own MetaTrader 5 Raw+ account — the broker's real pricing feed, not a third-party estimate.
- Captured in-terminal by an MQL5 expert advisor that logs every tick's bid and ask, so the spread is exactly what the platform shows.
- 3,714,831 ticks across 6 instruments; the figures refresh on a schedule.
- Demo and live Raw+ share the same pricing feed, so these spreads are representative of a funded account.
Spreads are variable and widen around high-impact news and the daily rollover. Past readings do not guarantee future spreads. Last updated 2026-09-15.
One number is a term, the other is a reading
It is worth separating the two kinds of figure that meet on this page. A term is something somebody published and stands behind until it is changed: the commission per lot per side, the contract size, the minimum order. A reading is something that was true at a moment and was written down with the time attached — which is what every spread here is. The rate between the dirham and the dollar belongs firmly in the first group, and that is the unusual part.
Most traders carry both kinds of uncertainty at once: a spread that moves through the day and a currency that moves against them while they are not looking. Here only the first one is live. That does not make trading cheaper, but it does make the cost easier to state in advance, which is a different and more useful kind of advantage.
Turning the cost column into a local planning figure
The practical use of this page is narrow and worth doing properly. Pick the two or three instruments you actually trade rather than the whole table, take the all-in figure for one standard lot on each, scale it to the lot size you really use, and convert once into dirhams. Because the conversion factor does not drift, that sheet stays usable — you update the spread column when the feed is re-read, and nothing else.
Keep two things out of that figure so it does not quietly become wrong. It covers the spread and the commission on a round turn; it does not cover a position held past the rollover, which picks up swap from our swap rates page, and it says nothing about what your own bank charges to move money into the account in the first place.
The order in which the numbers are useful
In sequence, planning a trade from a local balance runs: instrument first, because the contract behind it decides what a point is worth; then the all-in cost for that instrument from the table above; then the overnight side, if the position is meant to survive a rollover; then a single conversion at the end. Doing the conversion last, once, is what keeps the sheet stable — the alternative is converting each line and repeating the exercise every time one of them is re-measured.
The comparison between account types belongs one step earlier and only has to be made once, on our spreads and costs page; the specification each of these numbers rests on is on trading conditions. Spreads are variable and past readings do not guarantee future ones, so treat the whole sheet as a plan rather than a quote.